
Supply chain & procurement
See the decisions behind the spend.
Connect purchasing data to the decisions it should support. Supply-chain analytics brings SAP, SharePoint and Excel information into views of consumption, reorder performance, vendors and spend.
- Power BI
- SAP
- SharePoint
- Excel
THE BUSINESS NEED
Start with the work that needs to improve.
Purchasing, consumption and supplier information are fragmented, making it difficult to judge reorder policy, supplier terms and working-capital pressure together.
Operational sources feed an analytical view of stock, suppliers and purchasing decisions.
The system behind the work
See how the work connects.
Choose a business view, follow its path, then see the related project screen.
Source information
Combined analysis
Decision views
Business use
The related project screen
Review stock policy
Reorder performance
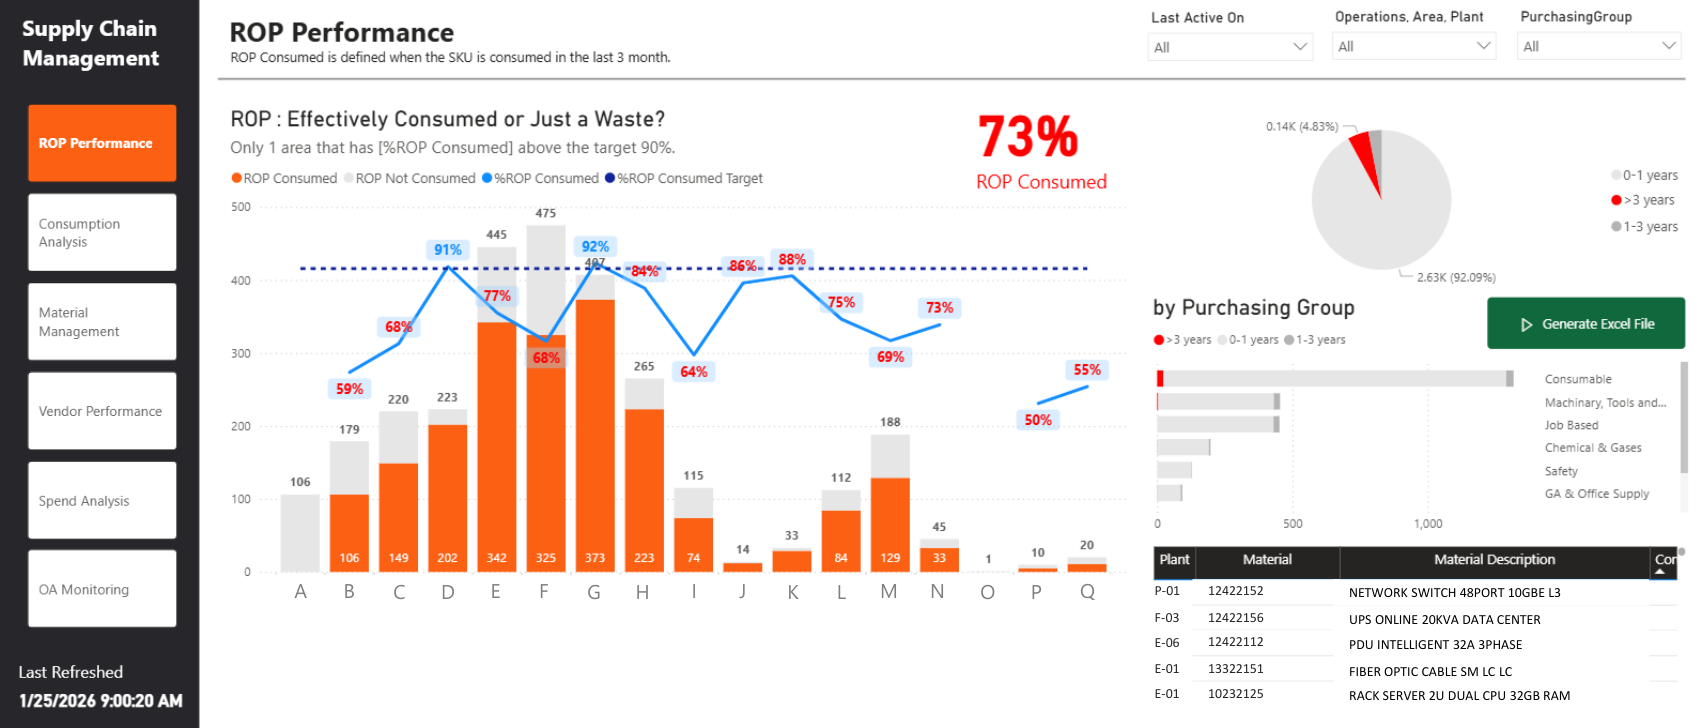
Original project screen: reorder performance, with identifying details anonymised.
01 / 03Understand consumption
Consumption analysis
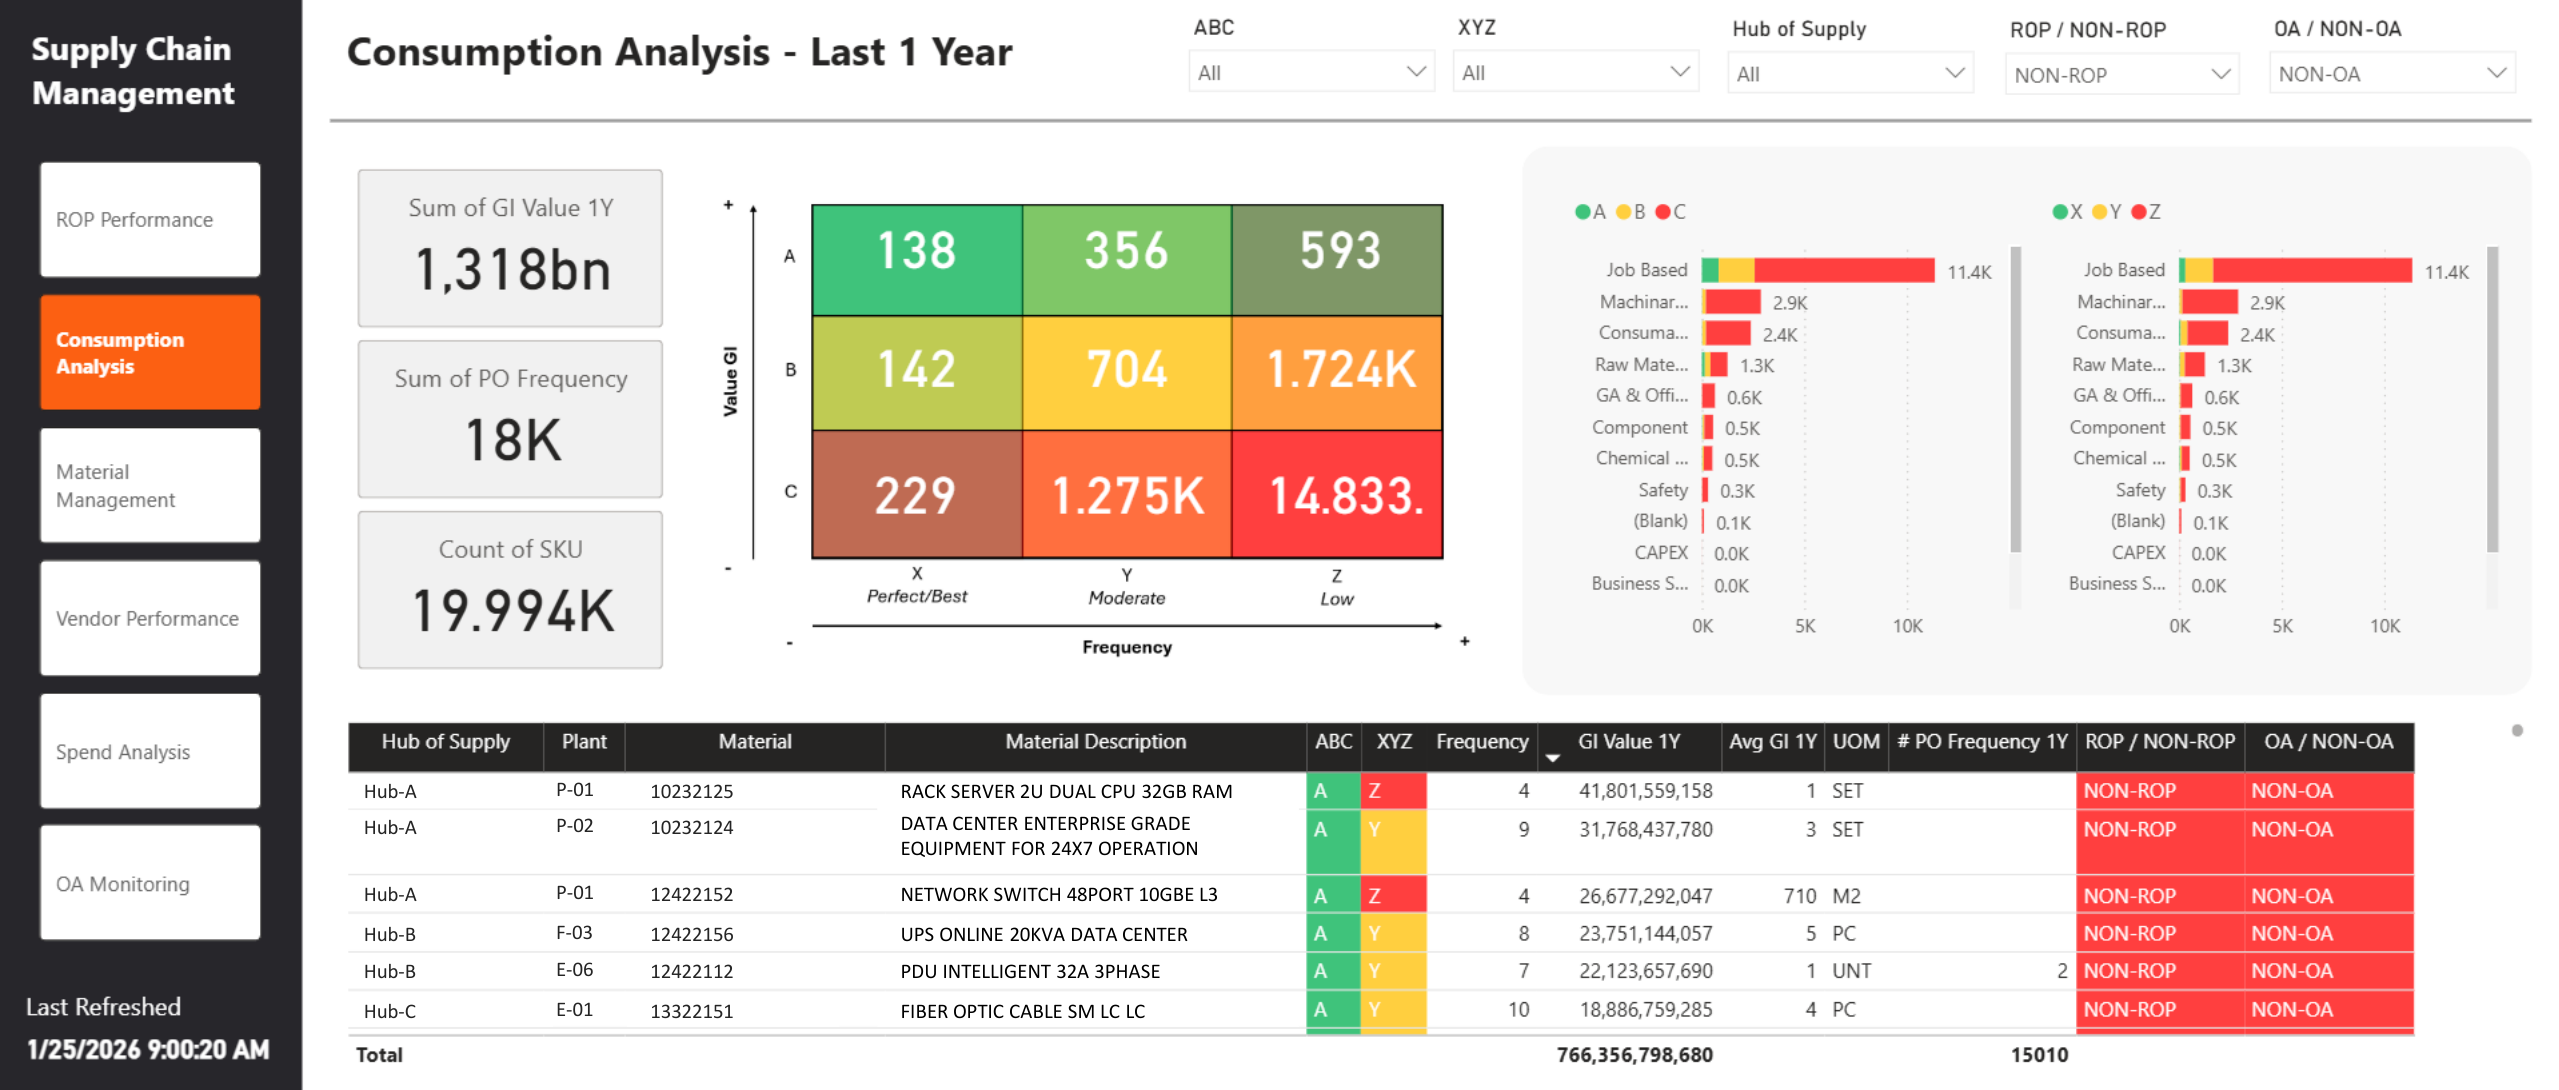
Original project screen: consumption analysis, with identifying details anonymised.
02 / 03Review the spend
Spend analysis
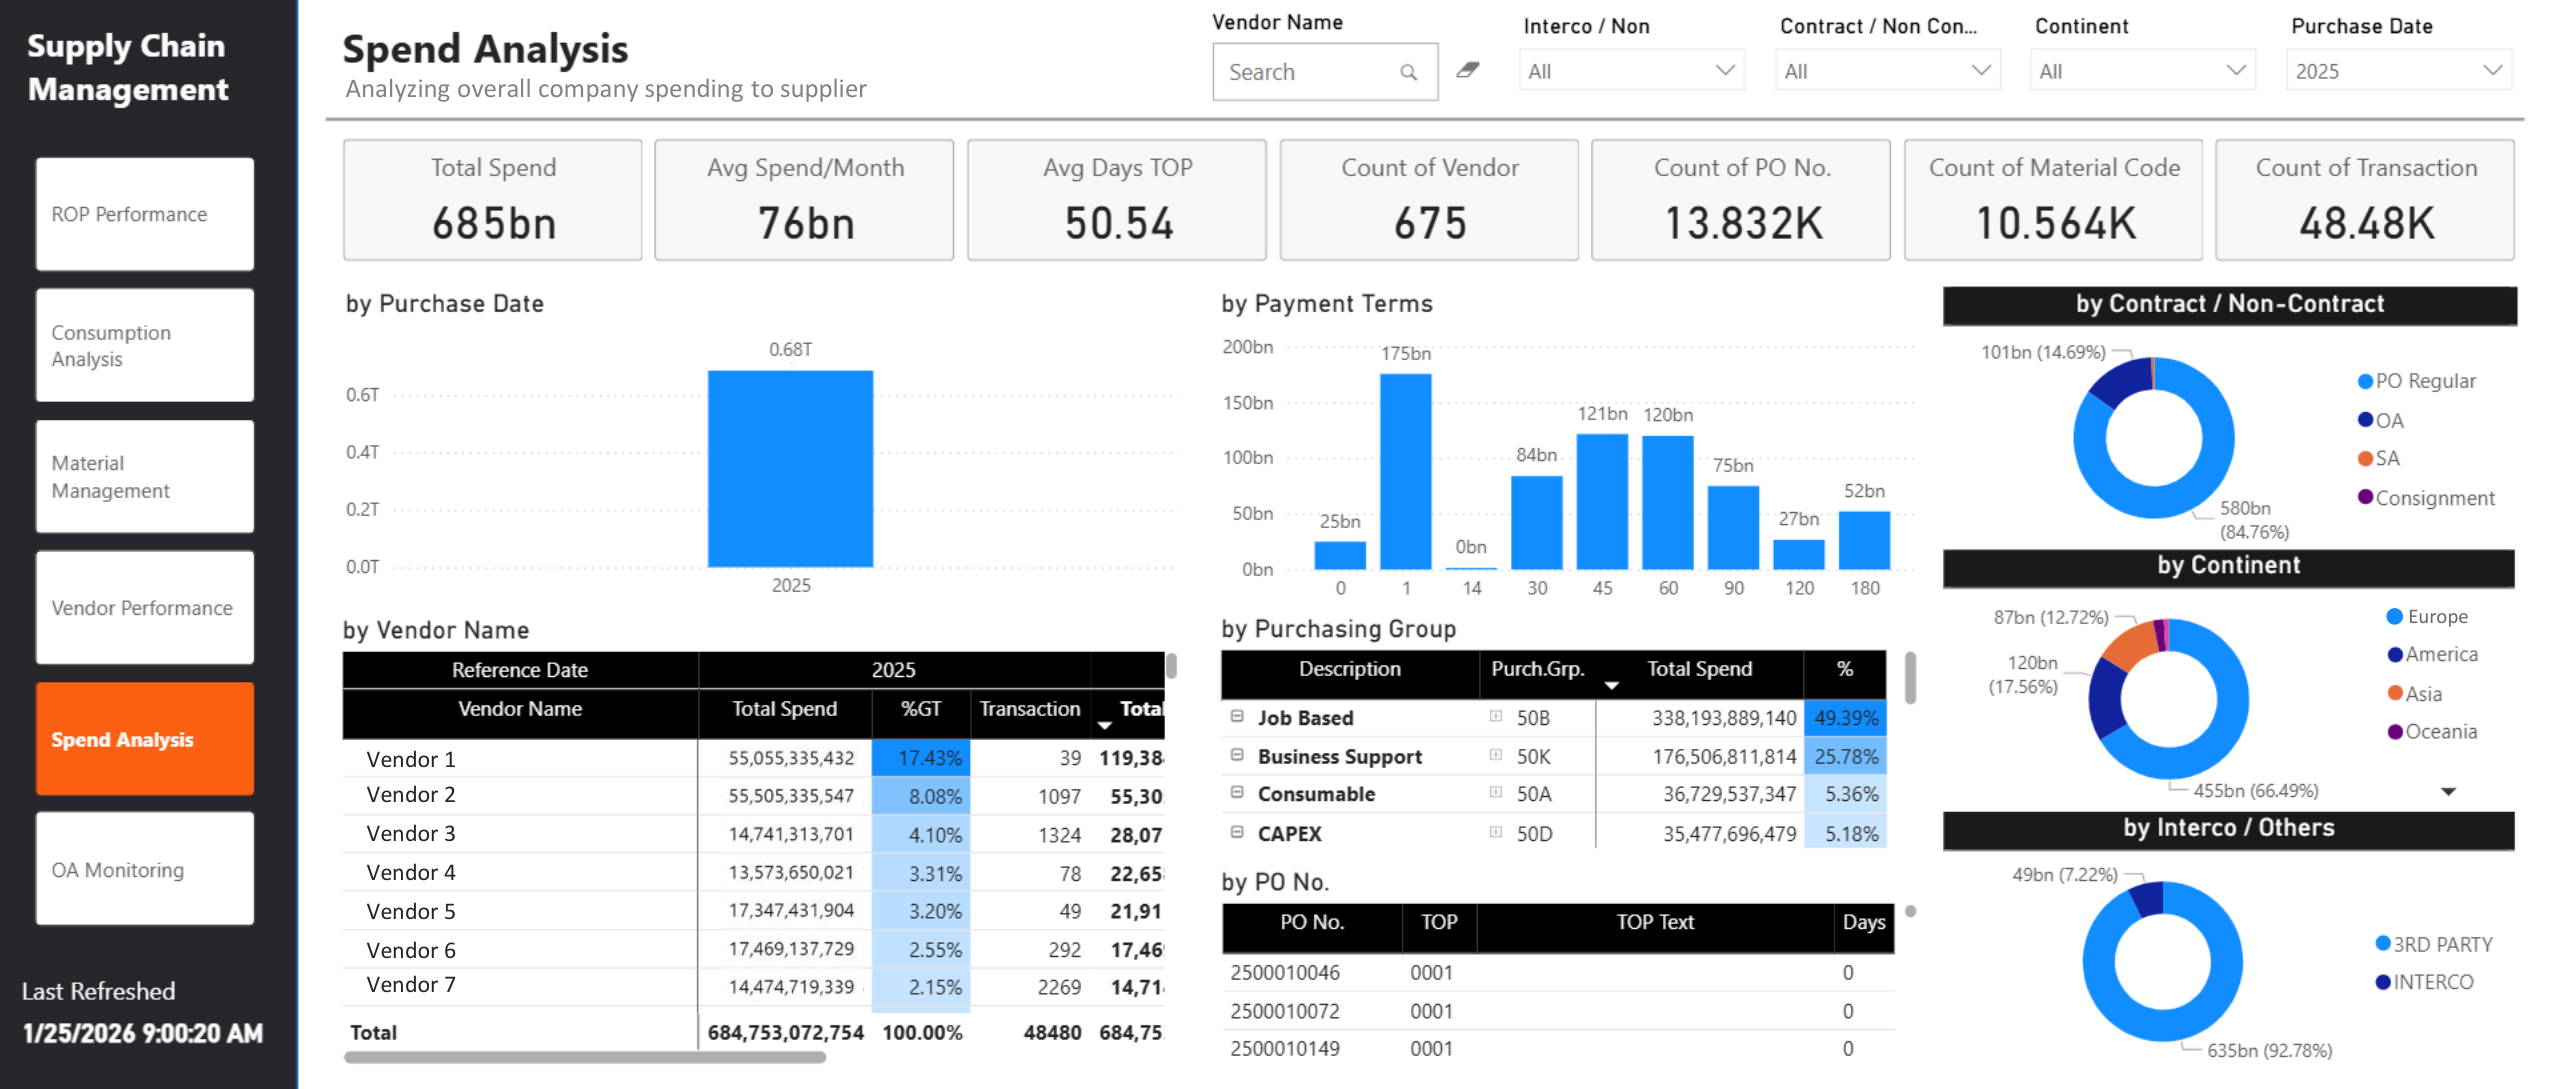
Original project screen: spend analysis, with identifying details anonymised.
03 / 03FROM ARCHITECTURE TO EVERYDAY WORK
One system. A clearer way of working.
A shared analytical view of stock, suppliers and spend.
What we delivered
- Combined analysis of SAP, SharePoint and Excel data
- Consumption, reorder, vendor and spend views
- Evidence for procurement and cash-flow planning
Original project screens, with identifying details removed or anonymised. Figures describe the captured records; no improvement metric is claimed.
Discuss a similar challenge