
MICROSOFT EXPERTISE / Power BI
See how the business is doing. Know where to act.
Connect relevant data, agree KPI definitions and give operations and leadership a clear view. Each dashboard starts with the business questions it must answer.
Send your project brief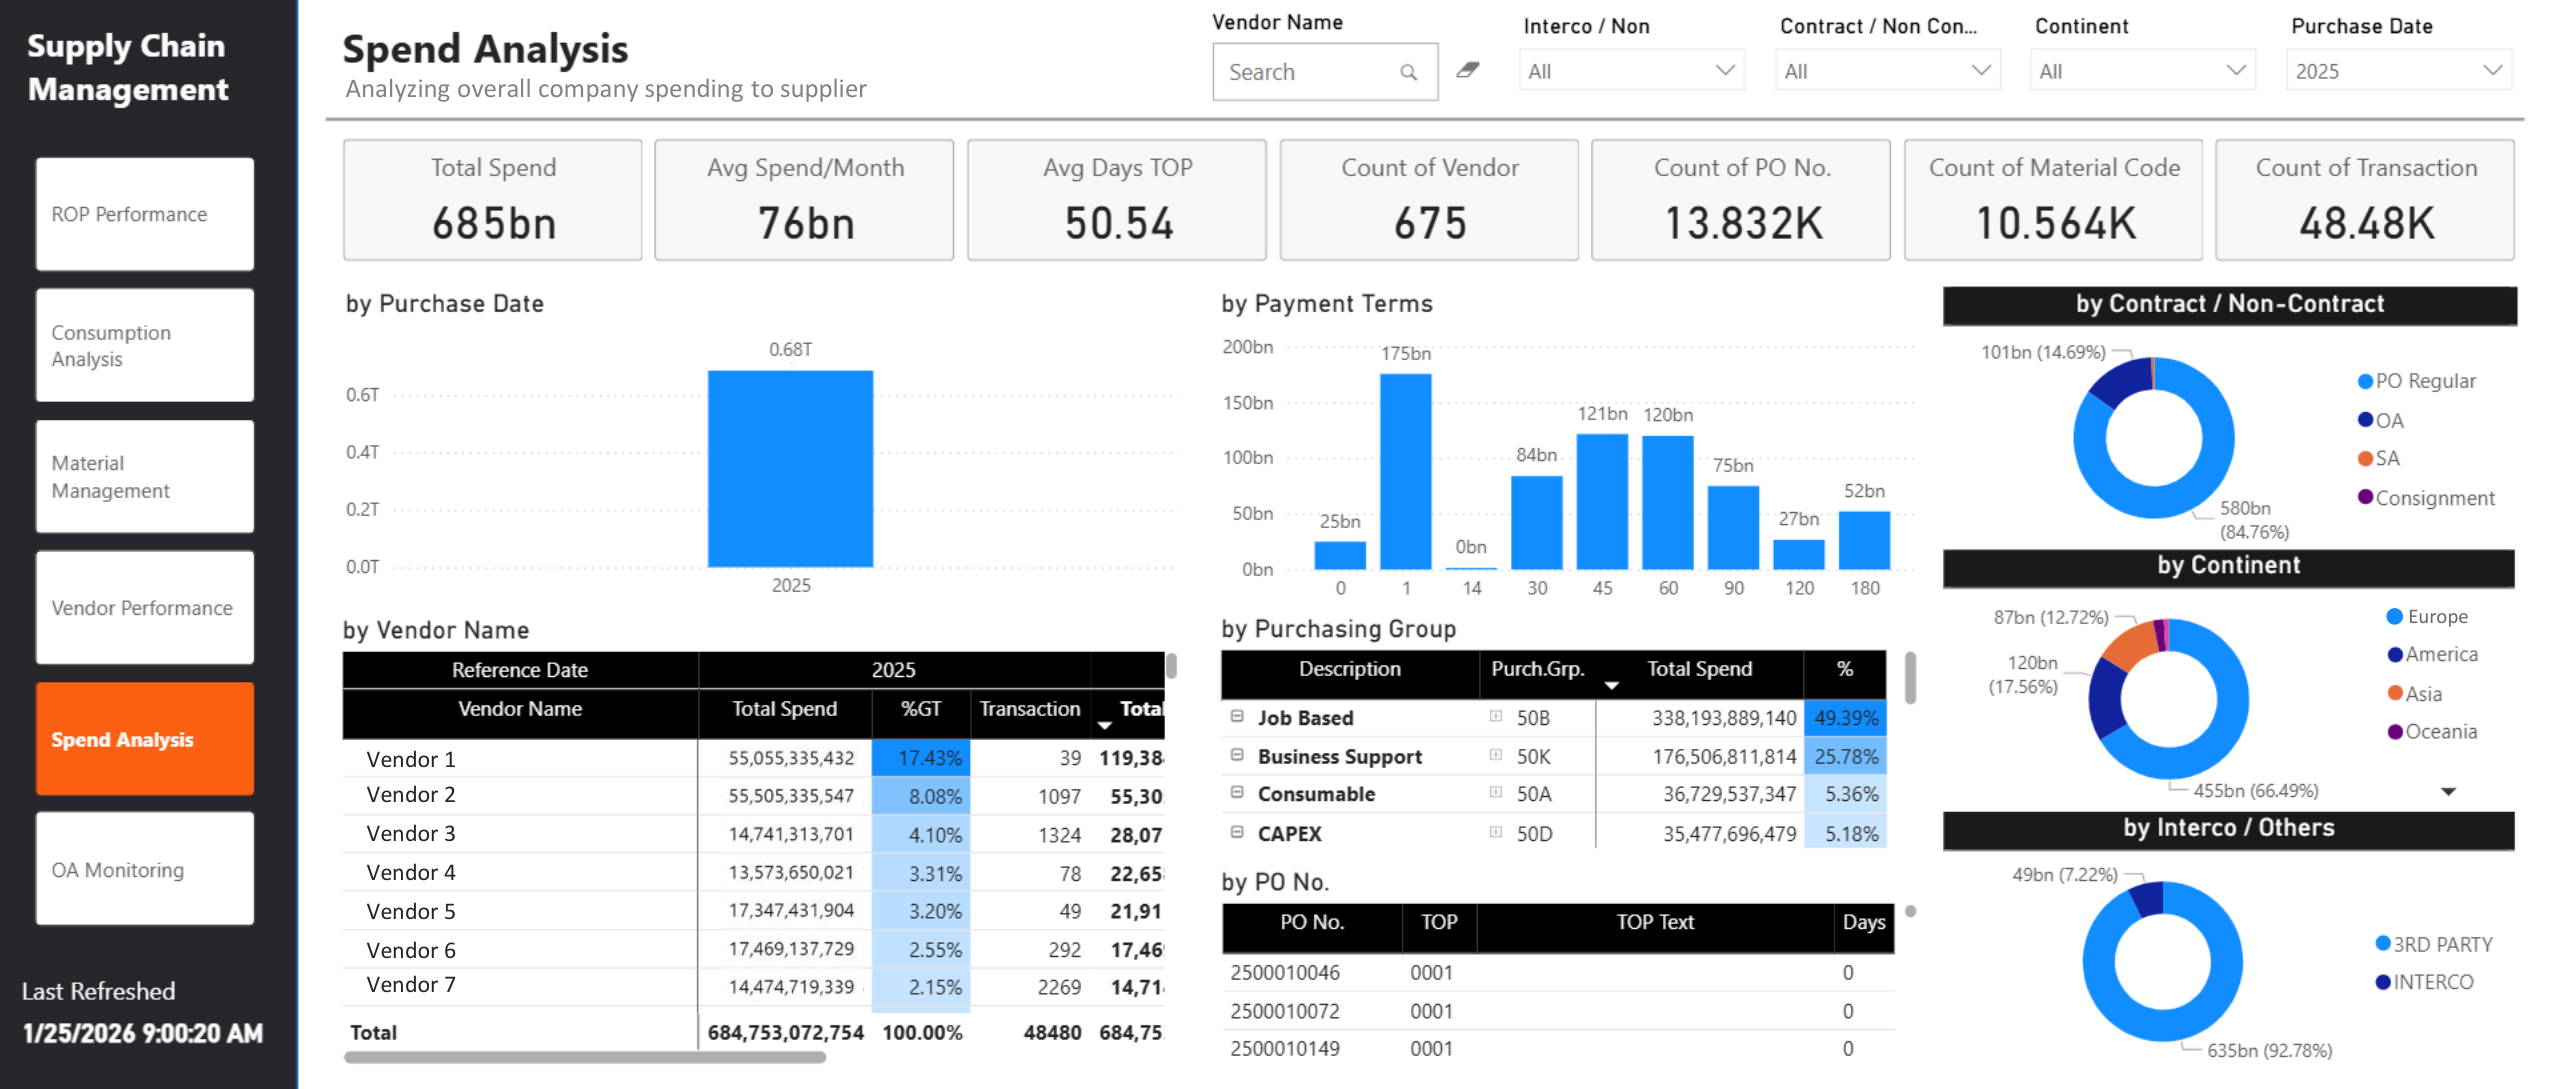
IN PRACTICE · Supply chain & procurement
See the decisions behind the spend.
Connect purchasing data to the decisions it should support. Supply-chain analytics brings SAP, SharePoint and Excel information into views of consumption, reorder performance, vendors and spend.
Explore how it worksRECOGNISE THE CHALLENGE
When the current way starts holding you back.
- Reports must be rebuilt every period
- Departments disagree on the numbers
- Leaders cannot inspect the details behind a summary
WHAT WE BUILD WITH YOU
From a need, to a working system.
- KPI definitions and source mapping
- Data model and required transformations
- Dashboards, filters and detail views
- Refresh, access and handover
PLANNED FROM THE START
The right fit for your context.
Refresh frequency, gateways, data quality, Power BI licences and row-level security are discussed in discovery. Real-time reporting depends on the source systems.
Talk through your situationTHE NEXT STEP
Start with the process you want to improve.
We’ll map the process, the people and your Microsoft environment, then clarify the scope and next step.